
Asset Allocation


OUR approach to asset allocation
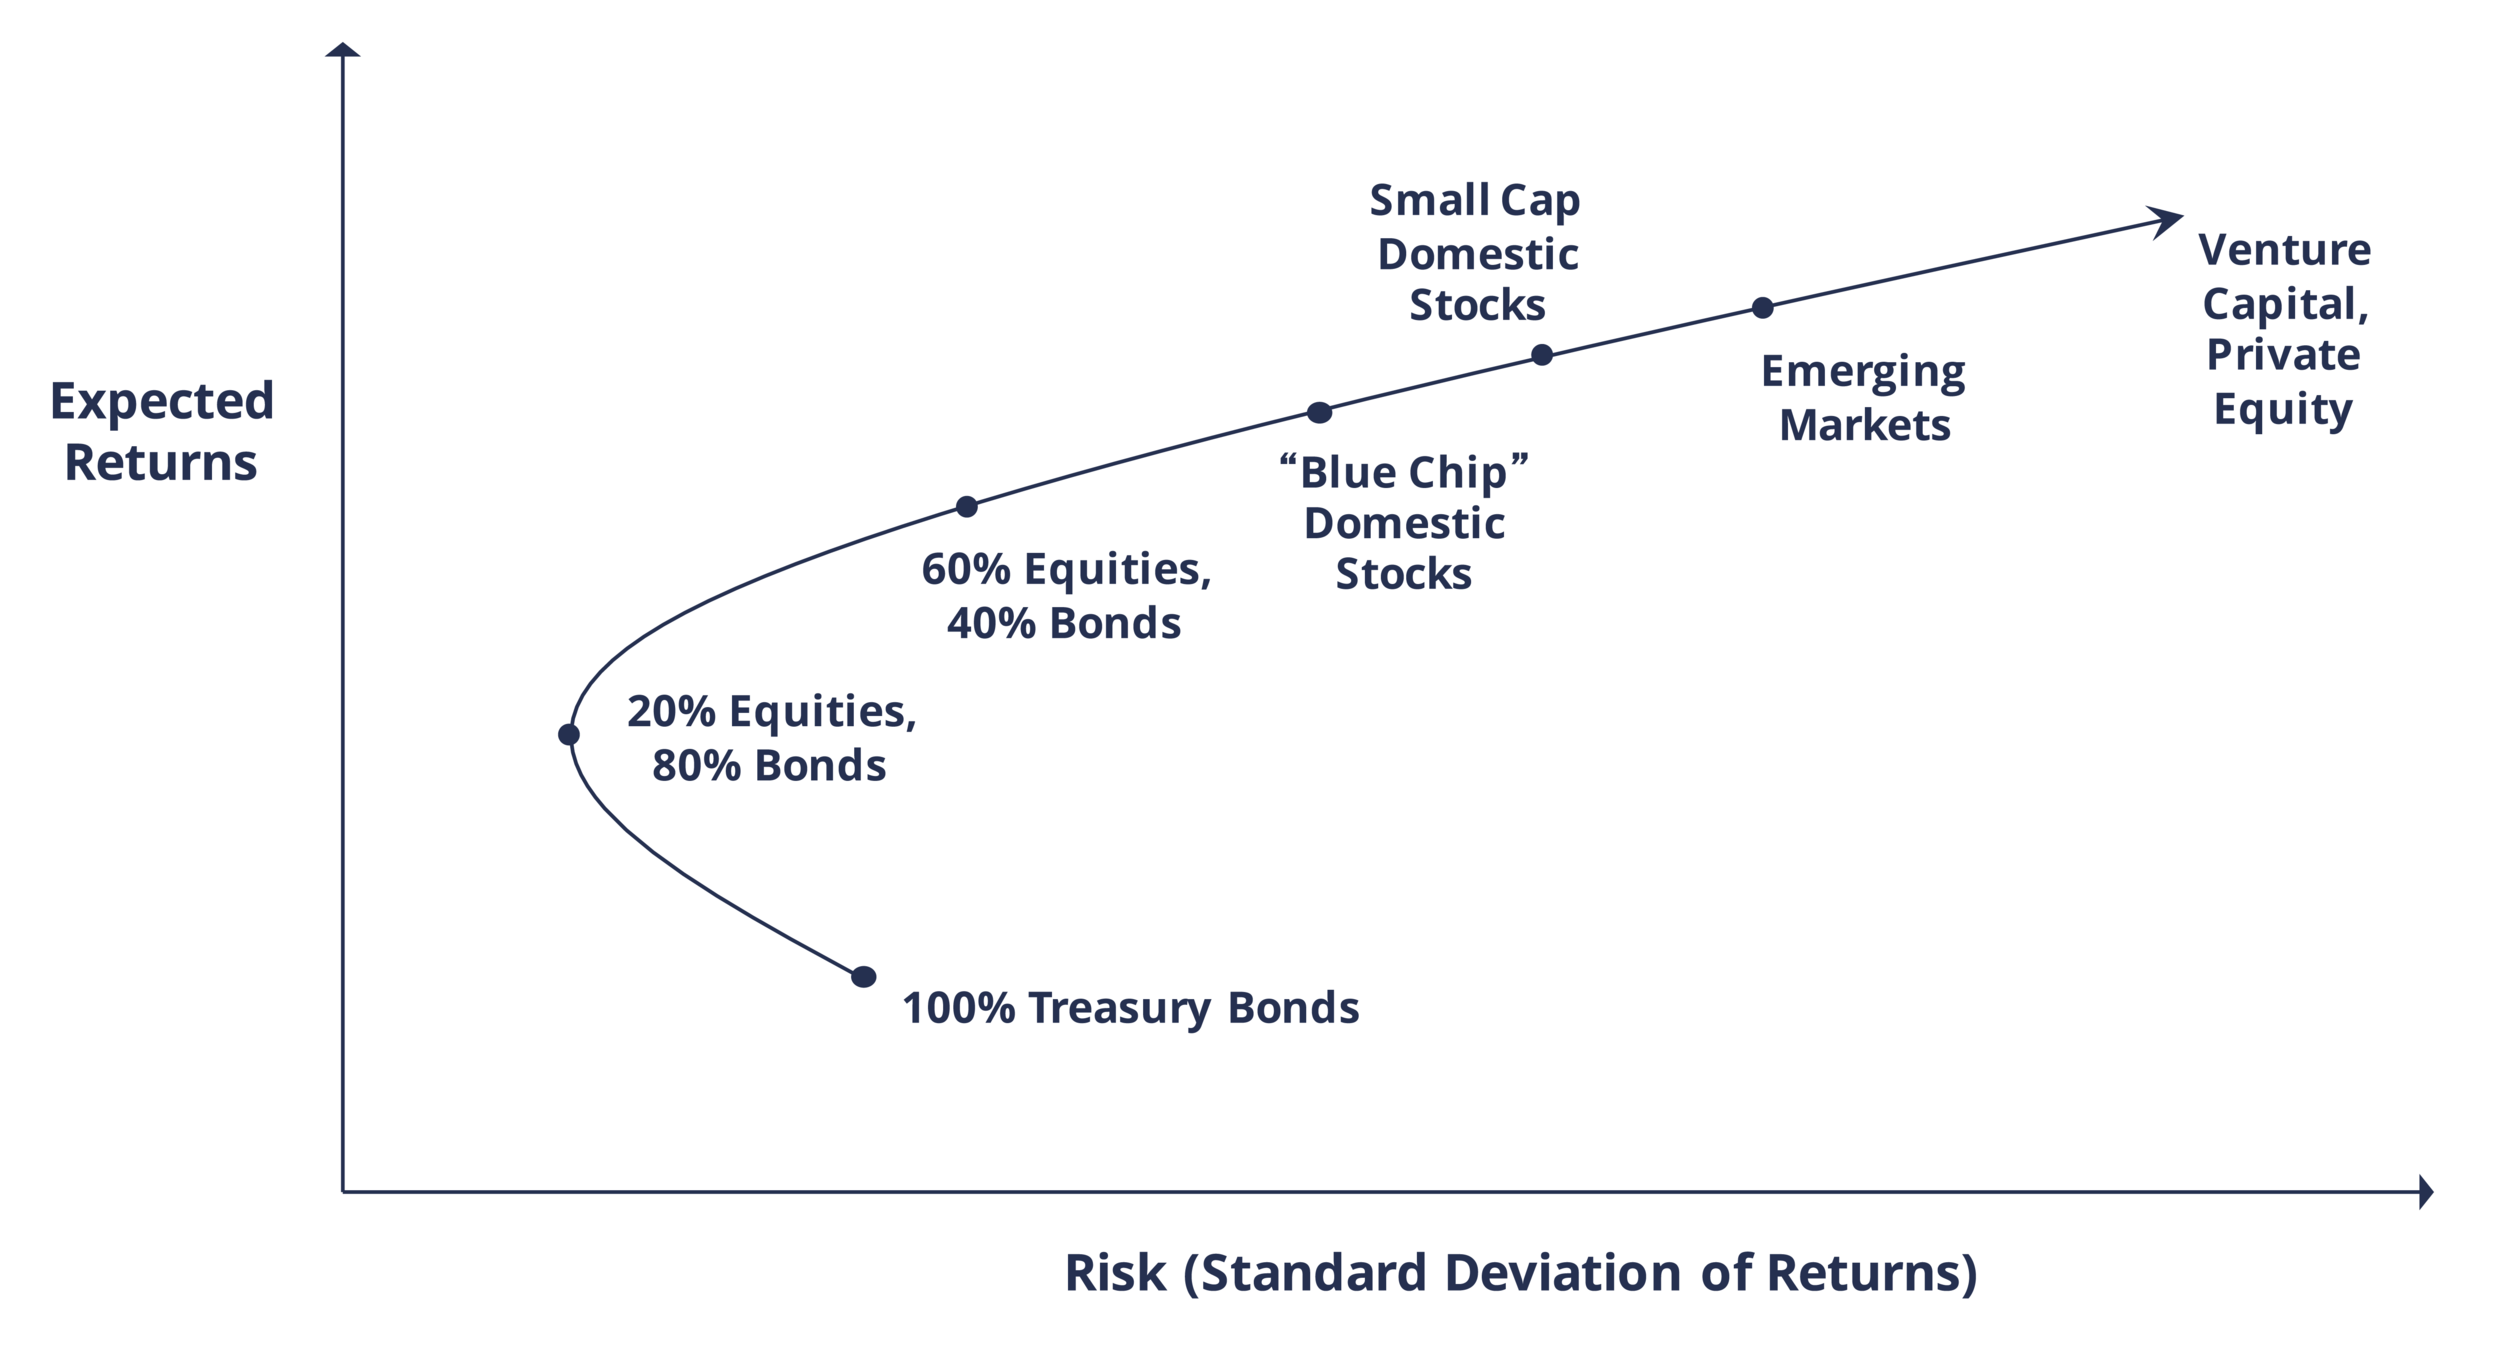
Deciding the broad allocation between stocks and bonds is one of the most important decisions an investor makes and generally drives risk and returns far more than the individual securities making up the portfolio. There is usually no one right answer, so what is most important is building the portfolio that is right for you.
Our approach is grounded in Modern Portfolio Theory, which advocates for the use of a wide array of asset classes in an attempt to maximize returns on a risk-adjusted basis and provide for a "smoother ride" for investors along the way. This leads us to incorporate Equities (stocks) and Fixed Income (bonds) into our portfolios as well as Alternative Investments (see third slide above) which tend to have characteristics somewhat in between the two.
We believe choosing the ideal asset allocation is a combination of art and science. From the science perspective, we have a number of tools at our disposal (see our Retirement Planning section) which allow us to "solve" for the right portfolio mix based on your specific financial situation.
However, sometimes there are elements of the conversation that cannot be easily quantified. This involves more conversation and soul-searching to determine the appropriate course of action. Some of our clients are in a situation where they can afford to take as much or as little market risk as they want - then it becomes a question of determining your comfort with losses and tolerance for risk.
Sometimes, a good conversation starter is simply to look at the below chart and ask yourself "Which path would you like to be on?"


After studying the chart, many conclude they'd like to be on the gold line - a perfectly smooth upward trajectory which still generates strong portfolio growth. Unfortunately, the gold line does not exist! In the real world, ups and downs of investment performance are a fact of life. The question is, how do you manage them?
It's also natural for many to say they would like to be on the blue line (which happens to be 100% stocks) - after all, this ends up with substantially more money at the end of 30 years than the other two lines. However, note that the blue line loses about 20% of its initial $1 million right out of the gates, and it takes about 6 years to just get back to even. Later on, the portfolio suffers a 30% drop with about $1.5 million in wealth wiped out. So maybe that is not for everyone.
The green line is essentially the most conservative portfolio that can be constructed - just 20% stocks. However, it is still subject to small ups and downs and bumps in the road.
For many investors, the correct path will be somewhere in between the two (such as the red line). And in order to chart the appropriate course, it is important to have a conversation about the tradeoffs between portfolio growth and stability. It is also important to revisit this choice periodically, because risk tolerance often changes based on changes in one’s life or financial situation.